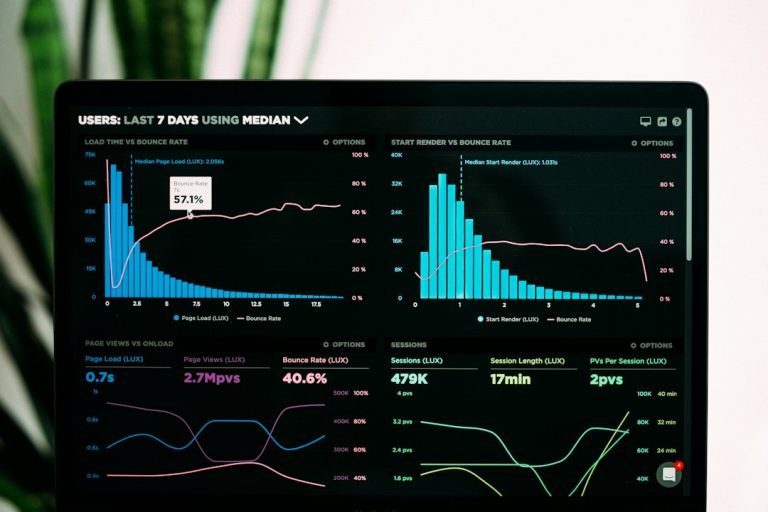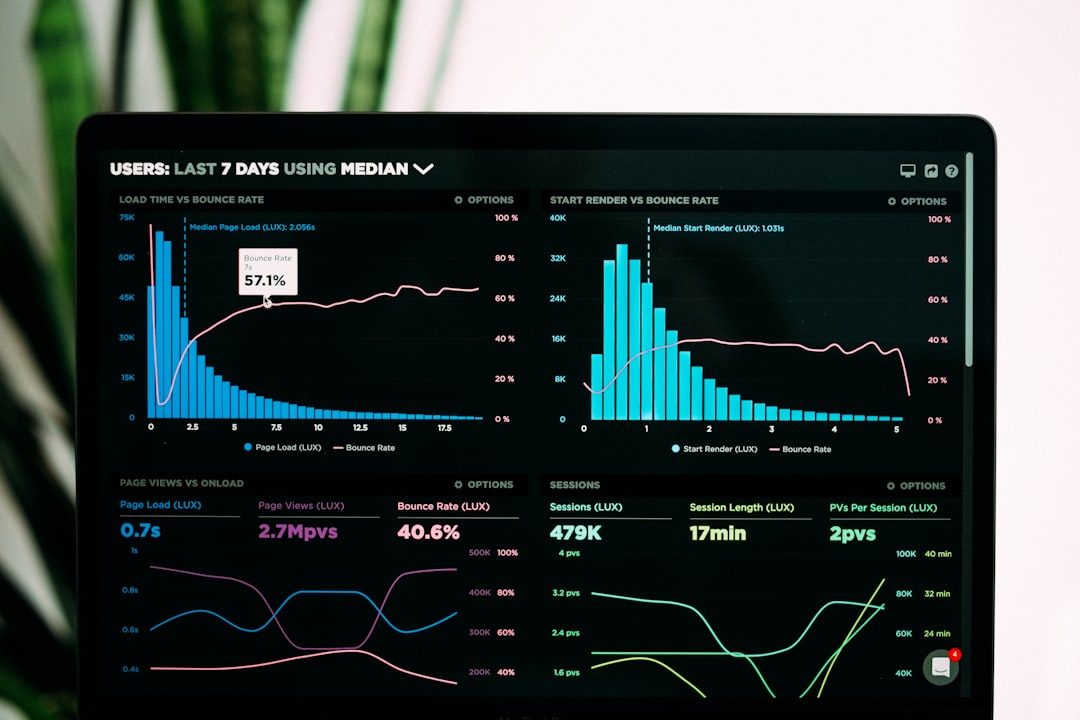
Debugging embedded software can feel like playing hide and seek with a tiny robot. The bug is there. It is blinking at you. But it will not say where it lives. MCUViewer helps by showing live data from your microcontroller in a friendly visual way.
TLDR: MCUViewer is a handy tool for watching embedded variables, signals, and system behavior in real time. It is useful when you want charts, gauges, and logs without building a giant test setup. For example, a motor control developer could watch speed, current, and temperature every 10 ms and spot a 15% current spike during startup. It is not a full replacement for a debugger, but it makes embedded debugging much easier to see.
What Is MCUViewer?
MCUViewer is an embedded development tool for visualizing data from a microcontroller. Think of it as a dashboard for your firmware. Instead of staring at raw numbers in a debugger, you can watch values move on charts, gauges, and tables.
It is made for engineers, makers, students, and anyone who works with microcontrollers. It can be helpful with projects like:
- Motor control
- Sensor systems
- Battery management
- Robotics
- IoT devices
- Control loops
- Real-time signal testing
The main idea is simple. Your firmware has variables. MCUViewer helps you watch them while the chip is running. That is a big deal. Embedded bugs often happen only when the system is alive and moving.
Why Embedded Developers Like It
Classic debugging is powerful. But it can be clunky. If you pause the CPU with a breakpoint, the real-time behavior changes. Motors stop. Timers pause. Communication breaks. Your bug may disappear like a sneaky raccoon.
MCUViewer is useful because it keeps things visual. You can monitor live values while the program continues to run. That makes it easier to understand timing, trends, noise, and sudden jumps.
For example, imagine you are tuning a PID controller. You need to see:
- Setpoint
- Measured value
- Error
- Output
Reading those numbers one by one is boring. Plotting them together is magic. You can instantly see overshoot, delay, instability, or noise.
Main Features of MCUViewer
1. Real-Time Variable Monitoring
This is the star feature. MCUViewer can show variables while the firmware runs. You can track integers, floats, flags, counters, state values, and more.
This is great for checking if your code is doing what you think it is doing. Spoiler: firmware often has its own plans.
2. Graphs and Charts
Graphs make data easier to understand. MCUViewer can turn changing values into live plots. This helps with signals, sensors, control loops, and performance checks.
A chart can show a problem in two seconds. A table may hide it for two hours.
3. Custom Dashboards
You can build a screen that fits your project. Add the values you care about. Remove the noise. Make it clean.
A good dashboard can include:
- Live plots
- Numeric fields
- Status indicators
- Controls
- Logs
This makes MCUViewer feel less like a dull lab tool and more like a cockpit. Tiny spaceship not included.
4. Data Logging
Sometimes you need proof. MCUViewer can help record data for later review. This is useful when a bug happens once every 30 minutes and then vanishes.
With logged data, you can compare runs. You can share results with teammates. You can also say, “Look, the bug is real.” Very satisfying.
5. Works Alongside Other Tools
MCUViewer does not have to replace your existing workflow. You can still use your IDE, compiler, debugger, and hardware probe. MCUViewer simply adds a visual layer.
It fits nicely beside tools like:
- STM32CubeIDE
- Keil
- IAR Embedded Workbench
- VS Code with embedded extensions
- GDB based workflows
- OpenOCD setups
MCUViewer Pros
- Easy to understand: Visual data is faster to read than raw values.
- Good for real-time systems: You can watch behavior while code runs.
- Useful for tuning: Great for PID loops, sensors, and motor control.
- Helpful for teams: Charts are easy to share and explain.
- Less guesswork: You see trends instead of guessing from symptoms.
MCUViewer Cons
- Setup may take time: Embedded tools always enjoy asking for “just one more config file.”
- Hardware support matters: Your probe, chip, and interface can affect the experience.
- Not a full debugger: You still need breakpoints, stepping, and memory inspection sometimes.
- Too much data can overwhelm you: A dashboard with 80 signals is not a dashboard. It is spaghetti.
Who Should Use MCUViewer?
MCUViewer is a strong match for developers who need to see live firmware behavior. It is especially helpful when working with real-world signals.
You should try it if you often say things like:
- “Why does this sensor value jump?”
- “Why does my motor shake at startup?”
- “Why does this control loop drift?”
- “Why does the bug happen only when nobody is watching?”
It is also useful for teaching. Students can see variables change live. That makes abstract firmware ideas feel real.
A Simple Use Case
Let’s say you are building a small temperature controller. The microcontroller reads a sensor and drives a heater. The target is 60°C.
Without MCUViewer, you may print values over UART. That works, but it can be messy. You get a waterfall of numbers. Your eyes get tired. Your coffee gets cold.
With MCUViewer, you can plot:
- Target temperature
- Actual temperature
- Heater power
- Error value
Now you can see if the system reaches 60°C smoothly. Maybe it overshoots to 68°C. Maybe it takes 120 seconds instead of 60. Maybe the sensor noise is bigger than expected. These are the kinds of details that matter.
Embedded Development Tools That Pair Well With MCUViewer
MCUViewer is only one piece of the embedded puzzle. A healthy toolchain often includes several tools.
- IDE: For writing, building, and flashing code.
- Debugger: For breakpoints, stepping, and inspecting memory.
- Logic analyzer: For checking digital signals like SPI, I2C, and UART.
- Oscilloscope: For analog signals, noise, and timing.
- Version control: For saving your code history.
- Static analysis: For catching bugs before they run.
MCUViewer shines in the “what is my system doing right now?” zone. It is not trying to be everything. That is a good thing.
Best MCUViewer Alternatives
1. STM32CubeMonitor
STM32CubeMonitor is a good option for STM32 users. It can display live variables and build dashboards. It is especially attractive if your project already lives in the STM32 ecosystem.
2. SEGGER SystemView
SEGGER SystemView is excellent for RTOS tracing. It helps you understand tasks, interrupts, and timing. If your problem is scheduling, this tool can be a superhero cape.
3. Percepio Tracealyzer
Tracealyzer is another strong tracing tool. It is great for RTOS-based systems. It shows timelines, task activity, and system behavior in detail.
4. NXP FreeMASTER
FreeMASTER is popular for NXP projects. It supports real-time monitoring, control, and visualization. It is often used in motor control and automotive-style applications.
5. Serial Plotter Tools
Simple serial plotters are great for small projects. They are easy to use. You send values over UART and plot them on a PC. They are not as advanced, but they are quick and friendly.

Final Verdict
MCUViewer is a practical and friendly tool for embedded debugging. It makes invisible firmware behavior visible. That is its superpower.
It is best for live variable viewing, signal plotting, dashboard building, and system tuning. It is not the only tool you need. But it can make your debugging sessions faster and less painful.
If your firmware deals with sensors, motors, loops, timing, or real-world weirdness, MCUViewer is worth a look. It turns “I think this is happening” into “I can see this happening.” In embedded development, that is a big win.